Periodontal Charting for Smarter Decisions
A comprehensive periodontal charting and analytics platform that empowers dental teams to make data-driven treatment decisions.
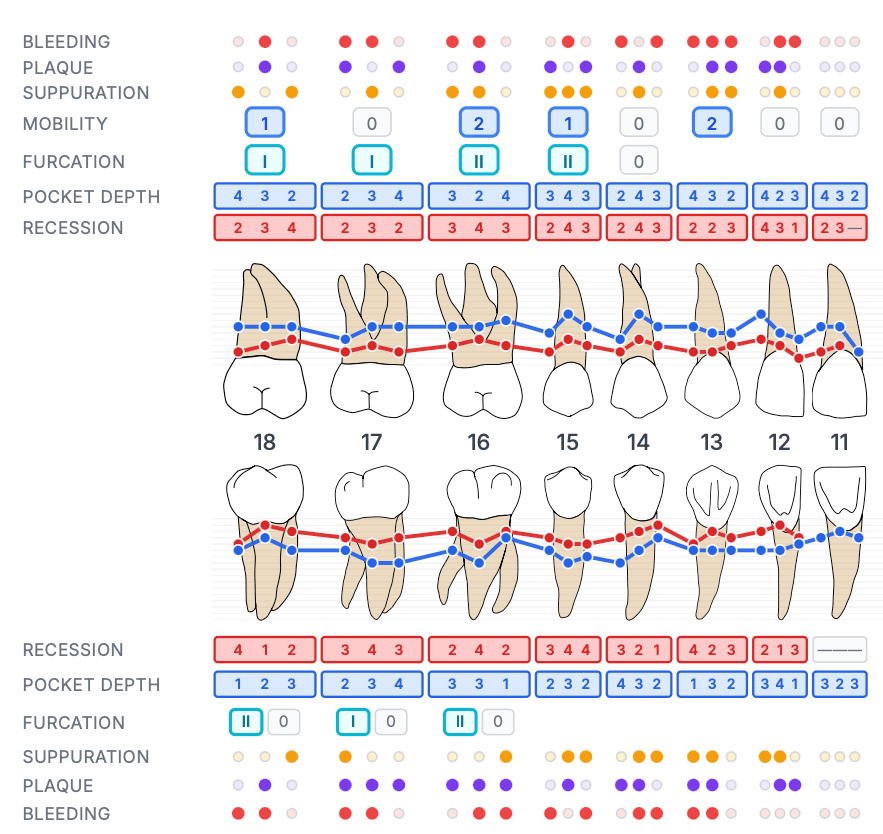
Patient progress at a glance
Trusted by Dentists Worldwide
Dental professionals across the globe rely on Zermmi Perio to streamline periodontal charting and improve patient outcomes.
Charts Created Daily
Countries
Dentists
Chart in Three Simple Steps
Set up your patient, record clinical data with keyboard shortcuts, and export a clinic-ready PDF — all in minutes.
Set Up Patient & Clinician
Enter patient details, assign a clinician, and choose full-mouth or quadrant charting to get started.
Record with Number Keys
Type probing depths, bleeding, and recession using number keys and Enter — auto-advancing inputs keep you in flow.
Export to PDF
Download your completed periochart as a professional PDF for patient records, referrals, or clinical documentation.
Zermmi Perio has completely transformed how we handle periodontal charting. What used to take 15 minutes now takes 3. The keyboard-driven workflow keeps our hygienists in flow, and the PDF exports look incredibly professional.
Dr. Sarah Mitchell
Periodontist, Bright Smile Dental Clinic
Clinic-Ready Charting
Set up patient details, assign a clinician, and start a full-mouth or quadrant periochart in seconds.
Export & Save
Export your periochart to PDF for easy sharing with colleagues. Save chart data locally and upload it later when you're ready.
Fast Charting
Record probing depths, recession, and bleeding points with auto-advancing inputs.
PDF Export
Download charts as PDF for easy patient presentation or clinical documentation.
Enterprise Security
Enterprise-grade encryption for all data sent to our servers, keeping patient records safe.
Smart Summaries
Get instant periodontal summaries and progression insights from your charting data.
Powerful Features for Dental Teams

Summary
Bleeding on Probing
15%
Plaque
8%
Suppuration
2%
Mean Depth
2.4mm
Sites ≥4mm
12%
Deepest
6mm
Save Every Chart Per Patient

Percentage Trends
Pocket Depth Trends
Deep Sites Trend
CAL Trends
Analytics & Progression Charts
Treatment Simulation
Treatment Simulation: Show Patients Their Future Smile
Generate a smile preview of whitening or straightening from a single photo, and use it during patient consultations to set expectations and improve case acceptance.
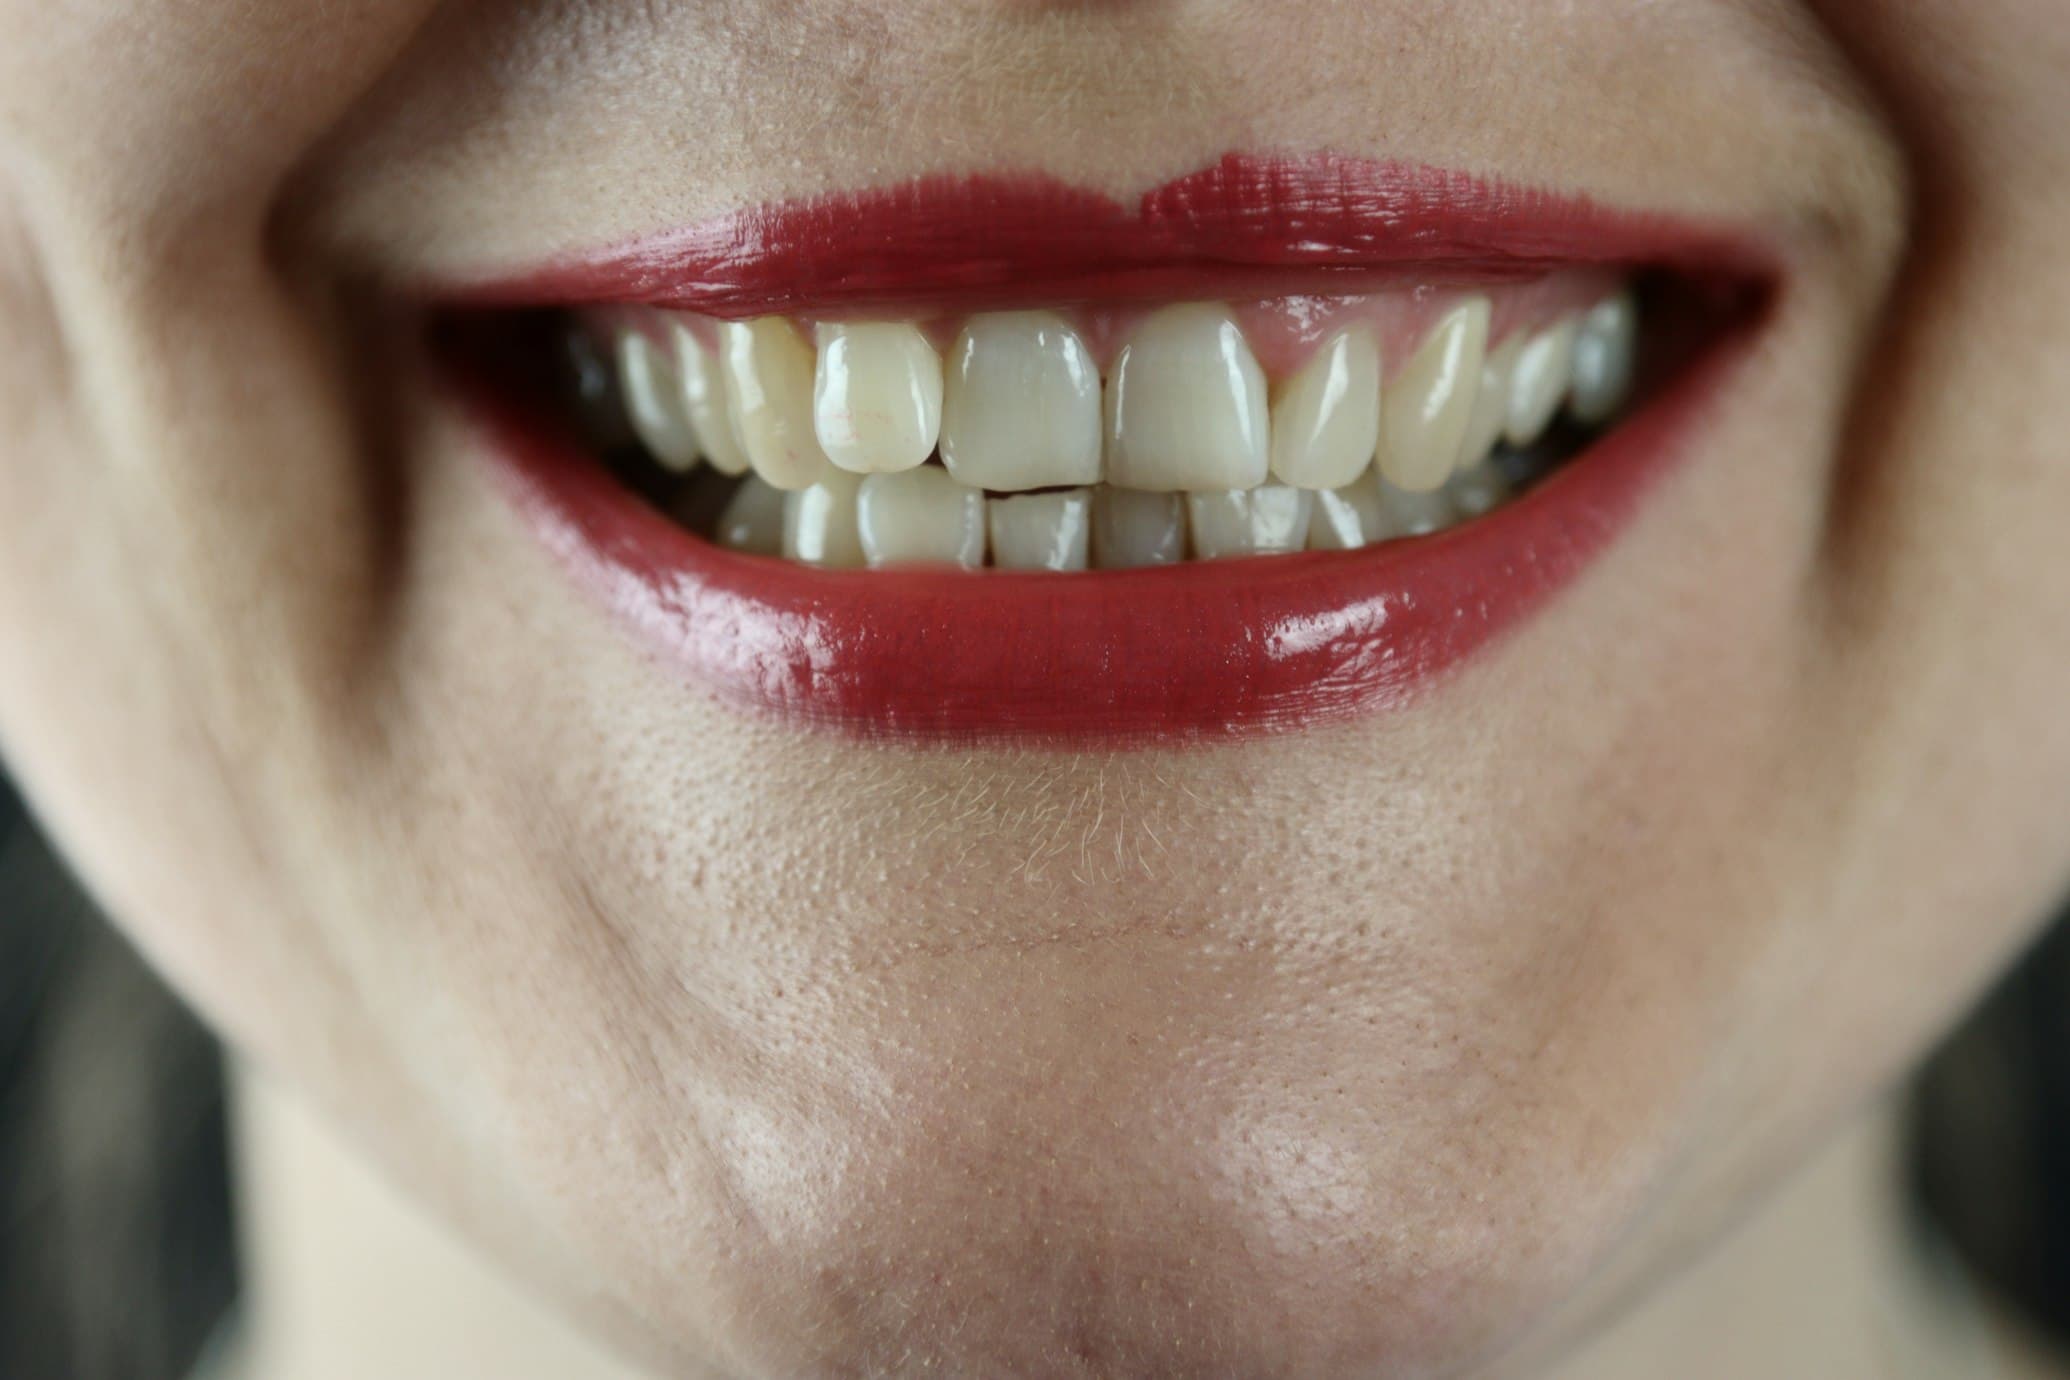
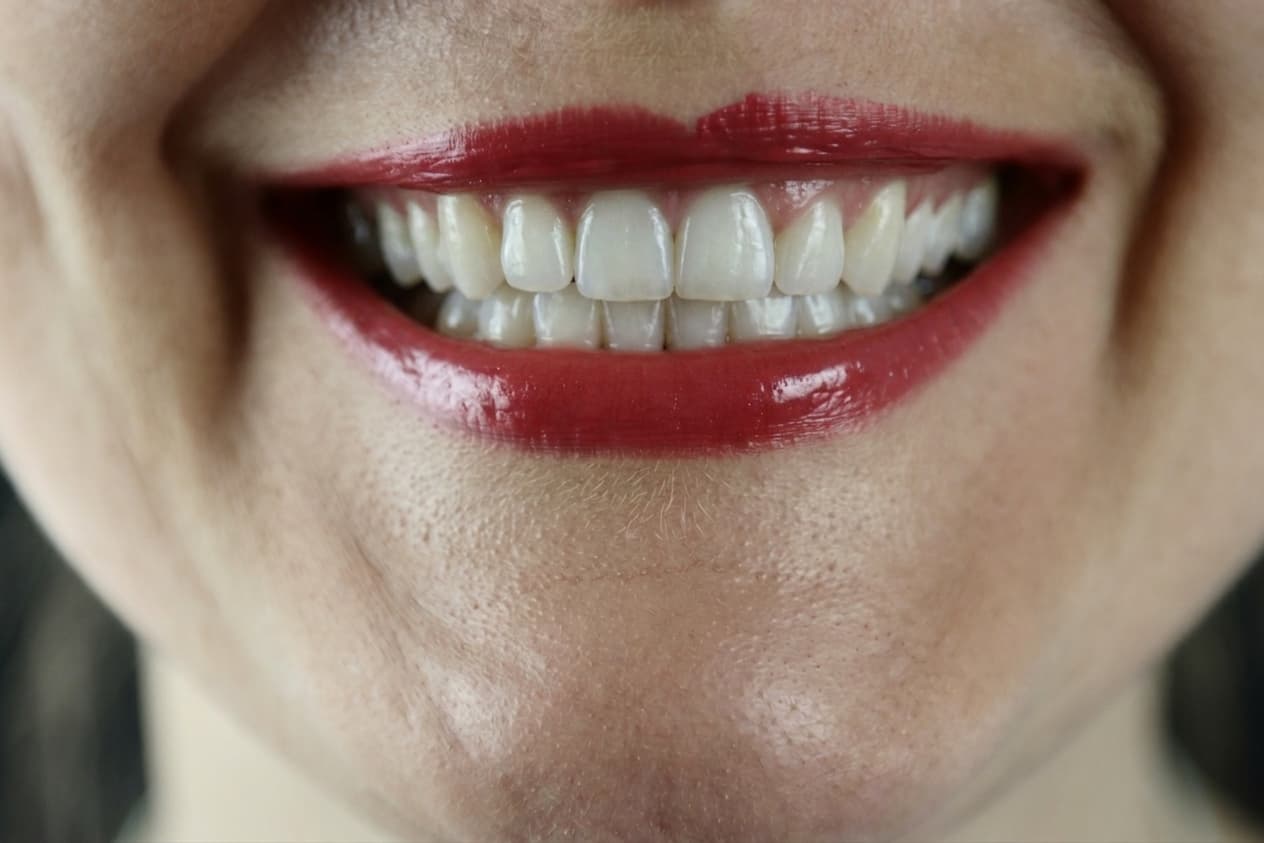
Illustrative preview. Actual clinical outcomes will vary.
Join the Waitlist for Our Full Dental Software
We're building a complete dental practice platform — charting, treatment planning, and patient management in one place. Sign up for private access at launch.